India introduced E85 in June 2026, its most ambitious step yet in reducing dependence on imported
crude oil. The backdrop could not have been more pressing — the West Asia conflict had effectively
shut the Strait of Hormuz, pushing petrol and diesel prices to levels most of us had never seen at
the pump. With roughly half of India’s natural gas still coming in as imported LNG, CNG prices had
also been climbing steadily through successive hikes. In that sense, E85 — a blend of 85% ethanol
and 15% petrol — was India’s answer to a question: can we power our vehicles with something we grow
ourselves?
But E85 is not E20. The earlier shift to 20% ethanol blending was largely seamless — existing
vehicles needed no modifications and most consumers barely noticed the change. E85 is a different
story entirely. It requires flex-fuel vehicles specifically engineered to handle high ethanol
concentrations, which means the success of E85 ultimately rests on a single decision: what car does
the consumer choose to buy?
That question leads us into far more complex territory. For most Indians, buying a car is one of the
biggest financial decisions of their lives — one they will live with for a decade or more. The
choice involves everything from fuel availability, resale value, and service networks to what the
neighbour might say. Add to this the fact that India is a vast, deeply unequal country where every
state tells a different story — different infrastructure, different state subsidies, and different
road conditions — and you realise that a single national narrative on fuel transition simply does
not exist.
This is my second article in this series. In the earlier piece, I analysed fuel transition trends
across the three-wheeler segment. You can read it
in the Latest Insights section. This time, the focus is on four-wheelers — passenger
cars and commercial cabs — and what VAHAN’s state-wise new vehicle registration data tells us
about where Indian consumers are actually placing their bets.
Same Car, Two Very Different Buyers
A car serves the same basic purpose — getting from point A to point B — but the reason behind the
purchase divides buyers into two fundamentally different camps. One group buys for personal travel;
the other buys to earn a livelihood through commercial hire. These two segments prioritise very
different things and, not surprisingly, make very different fuel choices. The cab buyer optimises
relentlessly for total cost of ownership. The private car buyer weighs reliability, comfort, brand
perception, and range alongside running costs. Thus, it is imperative that we analyse them
separately.
Passenger Cars: EVs Go Upmarket, CNG Goes Mass Market
Petrol remains the dominant fuel in the passenger car segment, though its share has eased from around
61% in FY20 to 56% in FY26. Diesel has seen a sharper fall — from 32% in FY20 to 19% in FY26, almost
halving in just six years. That lost ground has been divided between two gainers: CNG has tripled
its share from around 7% to 18%, and pure EVs have climbed from essentially zero to around 7%.
Within EVs, pure battery electric vehicles are outselling hybrid variants by roughly 2.5 times.
Personal Cars Trends
Monthly Trend (Absolute Volumes)
EV
CNG
LPG
Diesel
Petrol
Other
Note: "EV" includes Pure EV and Strong/Plug-in Hybrids. "Other" includes Mild Hybrids and emerging
fuels.
What is actually driving the shift?
There is a discernible pattern in who is switching to what. EV growth is concentrated in the compact-SUV and premium-SUV segments (e.g., Nexon EV, Harrier EV), while CNG growth is concentrated in the hatchback, sedan and compact-SUV segments (e.g., WagonR, Ertiga). Both fuels compete in compact SUVs, but EVs are moving up into larger SUVs where CNG has little presence, while CNG continues to gain share in the mass-market segments where EV adoption remains limited. Notably, neither fuel has meaningfully penetrated the large diesel SUV segment, which continues to be dominated by diesel powertrains.
This is somewhat surprising. Hatchback buyers typically prioritise low running costs, and EVs deliver the lowest cost per kilometre. However, higher upfront costs, uncertain resale values, limited access to home charging and the lack of a widespread DC fast-charging network have restricted EV adoption among value-conscious, high-mileage users. At the other end of the market, large SUV buyers could benefit from strong hybrids. However, hybrid growth remains constrained by limited model availability, with only a few OEMs offering the technology across their portfolio.
Commercial Cabs: CNG’s Cleanest Victory
The cab segment has undergone perhaps the most dramatic fuel transition of any four-wheeler category
in India. Five years ago, diesel ruled this space. Today:
- CNG holds approximately 70% share of new cab registrations nationally.
- Diesel has collapsed to around 12% from a position of near-dominance.
- EV penetration is about 3% nationally.
The diesel-to-CNG switch in cabs was policy-led and forceful. NGT mandates in Delhi, commercial
vehicle CNG mandates in Mumbai, Pune, and Ahmedabad, combined with the visible economics of lower
per-kilometre costs, made the choice easy for cab operators.
Cabs & Taxis Trends
Monthly Trend (Absolute Volumes)
EV
CNG
LPG
Diesel
Petrol
Other
Note: "EV" includes Pure EV and Strong/Plug-in Hybrids. "Other" includes Mild Hybrids and emerging
fuels.
Why is EV so low in cabs despite the economics?
This is one of the more interesting puzzles in the data. The running-cost case for EVs in commercial
use is arguably stronger than for private cars. But two structural problems hold EV cab adoption
back:
- The charging-time problem. For a cab driver, every hour the vehicle sits at a charger is income
lost.
- The lack of a widespread DC fast-charging network.
In the three-wheeler segment, battery swapping has partially solved this problem. No equivalent
swapping ecosystem exists for four-wheelers. However, starting April 2026, Delhi saw EV cab penetration
surge from ~15% to over 50–60% as operators front-loaded acquisitions ahead of a proposed Commission
for Air Quality Management (CAQM) roadmap targeting 100% of all new taxi registrations in the NCR
to be electric by April 1, 2027.
What Is Holding Back the Expansion of DC Fast-Charging Infrastructure?
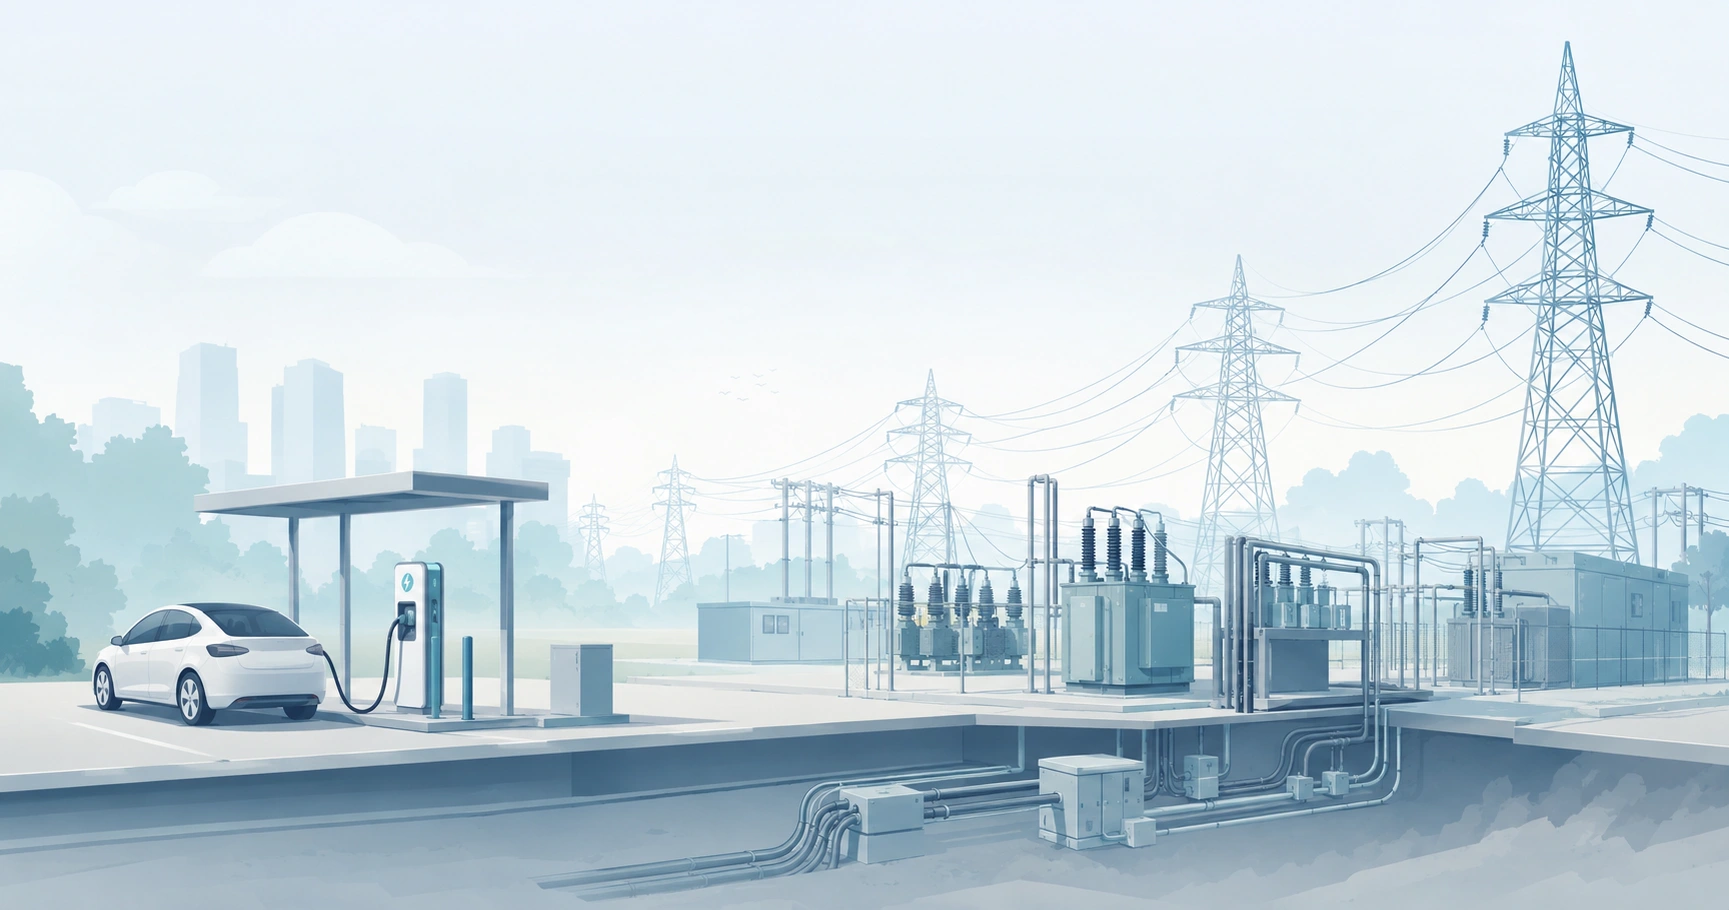
[Image: DC
Fast-Charging Infrastructure]
What you see at a DC fast-charging station — the charger unit itself — is not the expensive part. The
real cost is hidden upstream, in the grid infrastructure behind it. A single DC fast charger draws
roughly as much power as an entire apartment block, which means the local transformer often needs
replacement and the grid connection needs upgrading — both of which involve state power
distributors. They can be either the hero or the villain of the EV story, depending on their
connection charges, tariffs, and approval timelines. CNG, in contrast, had a workaround for exactly
this kind of upstream gap. Where the pipeline had not yet reached, CGD operators used cascades
(compressed gas trucked in via cylinders), allowing them to open outlets ahead of pipeline
infrastructure.
Further, even with DC fast charging, an EV typically occupies a charging bay for 20-40 minutes,
compared with about 3-5 minutes for refuelling a conventional vehicle. This significantly reduces
the number of vehicles that can be served per bay each day. As EV adoption scales, charging
infrastructure will need to extend beyond fuel stations into residential complexes, workplaces,
commercial parking facilities, and public parking spaces. Supporting such large-scale
electrification will require substantial upgrades to local power-grid infrastructure. AC chargers
are fine for home and two-wheeler charging but cannot solve the highway-corridor and quick-top-up
requirements that cars demand.
The State-wise Picture: India’s Fuel Geography
The most striking finding from the state-wise data is how concentrated both CNG adoption and EV
adoption are:
- Just 7 states and UTs account for approx. 88% of all CNG car registrations in India. These are
states with mature city gas distribution networks — Gujarat, Maharashtra, Haryana, and Delhi.
- 22 out of 36 states and UTs have CNG penetration below 4% in new car registrations.
- EV adoption is also concentrated, but less severely. Delhi, Chandigarh, and Telangana lead with
the highest EV shares in passenger car registrations. Several southern states — Kerala,
Karnataka, and Tamil Nadu — follow meaningfully above the national average.
An interesting anomaly in the cab segment: Andhra Pradesh — home to India’s largest producing
offshore gas fields in the Krishna-Godavari Basin — has less than 50% CNG penetration in new cab
registrations.
Top States Driving Passenger Car Sales (FY25-26)
Note: Charts display the top 4 states holding the major share of absolute vehicle sales in their
respective fuel categories.
State-wise Quadrant Analysis (FY25-26 National Mean)
Note: The crosshairs represent the National Weighted Average. Bubble size represents total vehicle
registrations in the state. Only states with significant volumes are shown.
Two Case Studies: Why Chandigarh and Tripura Stand Out
Rather than analyse the national average — which, as we have seen, masks enormous variation — it is
more useful to take two states that have done unusually well, each on a different fuel, and ask:
what did they get right?
Chandigarh: The EV Success Story

[Image:
Chandigarh EV Success]
The city had crossed 16% in new passenger car registrations in FY26 compared to national average of
7%. How? Initially, it was the financial incentive — by early 2025, ₹34 crore had been disbursed to
nearly 5,000 EV buyers by the Chandigarh Government. But two policy-design choices matter more than
the money itself: first, EV charging was made mandatory at every petrol pump in the city from day
one, so a buyer driving out of the showroom already knew that every fuel station had a charger.
Second, a single agency — CREST, the UT’s renewable energy body — ran the entire programme,
providing one portal for subsidy applications, one map for charger locations, and quarterly review
meetings chaired by the Chief Secretary with no inter-departmental maze.
The city helped, too. Chandigarh is 114 square kilometres of Le Corbusier’s grid — no daily commute
realistically exceeds 20 kilometres, which means the entry-level EV in today’s market can
comfortably cover a full day of city driving. Add to that one of India’s highest per capita incomes
and a large base of government employees with predictable commutes and access to home parking, and
the ingredients align in a way that most Indian cities cannot match out of the box. But the deeper
lesson is that most of these ingredients are policy choices, not geographical accidents. Specific
incentives, mandatory infrastructure, and one accountable agency — that combination moved markets
faster than any awareness campaign in any city.
Tripura: The CNG Story That Policy Textbooks Miss
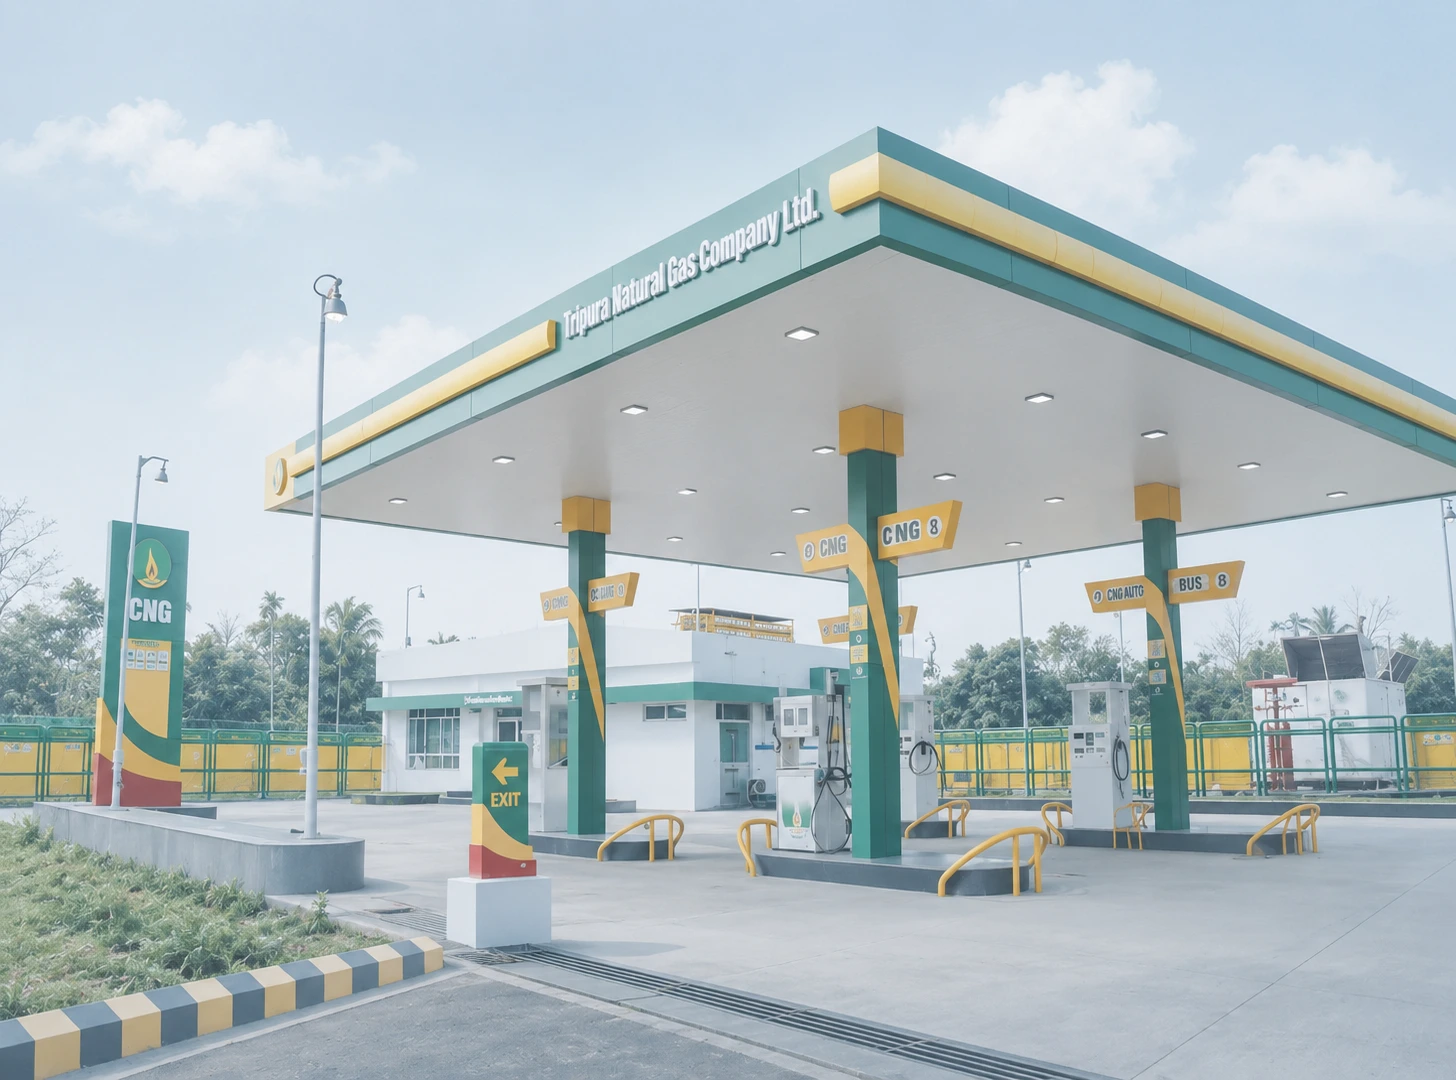
[Image: Tripura
CNG Story That Policy Textbooks Miss]
The usual CNG success stories are Delhi and Gujarat — cities with massive pipeline investments,
MGL/IGL networks, and decades of CGD build-out. Tripura is different, and arguably more instructive.
Tripura has abundant domestic natural gas production from onshore fields. Critically, Tripura sits
far from the national gas grid, which means gas could not be taken out of the state. The gas it
produces locally is consumed locally, at prices that have been insulated from global price shocks.
This isolation turned out to be an advantage. When global gas prices spiked after 2022 — with the
Russo-Ukrainian war disrupting European gas supplies and creating a scramble for LNG that sent
prices to historic highs — Tripura’s gas prices barely moved. The local CGD operator could keep CNG
affordable while still earning healthy margins. Those margins funded expansion of CNG stations,
which encouraged more consumers to switch, creating a reinforcing cycle that built on itself. There
is reportedly approximately one CNG station for every 2,500 passenger cars in Tripura — a ratio that
rivals or exceeds Delhi, India’s CNG capital. That density matters enormously for consumer
confidence.
So Will E85 Succeed?
The two case studies above actually answer the E85 question before it is even asked. CNG had
everything going for it in its early years — proven technology, a single nodal authority (MoPNG)
driving policy coherence, a compelling environmental argument, court-ordered mandates in key cities,
and a period of relatively low global gas prices. Yet CNG’s growth hit a wall the moment global
prices moved sharply upward. The fuel had no domestic price anchor; every LNG cargo imported at spot
prices became a rate hike for the auto driver and the middle-class car owner.
EV has the domestic fuel advantage that CNG lacked — electricity is entirely domestically produced
and domestically priced. No Putin, Trump, OPEC decision, or Hormuz disruption can push your
per-kilometre charging cost up overnight. But EV has the problem that CNG solved early on: power
infrastructure is a state subject, which means there is no single national authority to mandate
uniform charging access, set DISCOM tariffs for EV charging, or fast-track grid upgrades across 36
states and UTs simultaneously. Every startup that wants to build a DC fast-charging network must
negotiate with 36 different DISCOMs, 36 different land-acquisition processes, and 36 different
approaches to grid-upgrade cost sharing.
The lesson from CNG and EV is clear: what makes any alternative fuel succeed in India is the
combination of a domestic price anchor and a single accountable policy authority that can drive
infrastructure build-out uniformly across states. CNG had the authority but lacked the anchor. EV
has the anchor but lacks the authority. E85, if it is to succeed, needs both — and it needs them at
the same time. Whether it gets them is the question the next few years will answer.